 The most popular email marketing metric most online marketers talk about is email open rates.
Email open rates are often the first metric you see when you log into your email marketing platform and a lot of marketers measure the effectiveness of their marketing using it.
In this post I’ll tell you why this is the worst metric to measure so you don’t fool yourself into thinking your doing better at marketing than you really are.
Today…the truth will set you free 😉
How Open Rates Are Measured
Before getting too deep into today’s post it’s important to lay down the basic understanding of how open rates are measured. The graphic below gives you the most basic equation to learn when understanding open rates.

What a lot of marketers are not aware of is that every HTML based email contains an invisible 1px by 1px image that must be loaded in order for the email to be tracked as an open.
As you see…simply opening an email is not enough for it to reflect in your open rates. And that’s the problem.The truth is some people will open your email without you ever knowing it because they did not meet all the criteria I listed in the diagram above.
Lets take a look at a recent email I sent out.
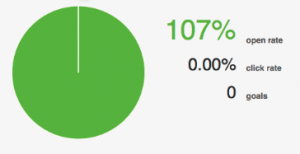
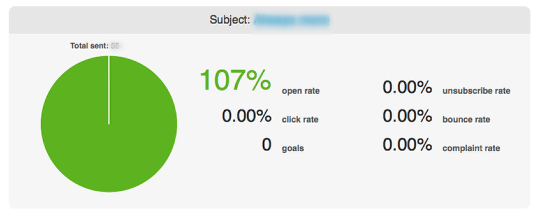
Incredible Email Open Rates?! Not So Fast…

Just imagine you log into your email marketing account and the first thing you see is an open rate over 100%. You start doing your happy dance and patting yourself on the back for writing the perfect email.
Until you look a little deeper (or until you read this post).
What you are seeing is the Regular Open Rate. What you really need to measure is the Unique Open Rate. Lets define the two…
Regular Open Rate – this metric reflects every time someone opens your email meeting the requirement listed above. So if one person opens the same email 3 times your open rate will reflect 3 opens.
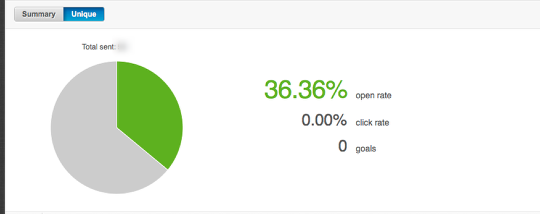
Unique Open Rate – this metric reflects the number of subscribers that opened your email. So if someone opens the same email 3 times the unique open rate will reflect 1 open.
In summary, Regular Open Rates focus on the email itself being opened, while Unique Open Rates focus on the amount of subscribers opening the email.
If you haven’t figured it out yet, Unique Open Rates are your friend and the closest you’ll come to an accurate metric when measuring open rates. With that in mind lets take a peek at the exact same email using the Unique Open Rate.
What Just Happened To My Perfect Email??!

The truth has been revealed. My Unique Open Rates show me what’s really going on. While 36% is far lower than 107% it’s a lot more accurate.
But it still isn’t the whole truth. And I’ve always been taught that the half truth is a whole lie. We have to take into account the Open Rate Equation I previously showed you. No matter if it’s a regular or unique open rate they still have to satisfy the 3 qualifying criteria to be registered as an open. (here’s the diagram again just in case you forgot):

Here are two questions to keep in mind when looking at your open rates:
- Are they viewing your email in a client that has HTML enabled?
- Do they have images enabled?
Answering “No” to either of these questions will result in a non registered open rate in your email analytics.
So What Can You Trust?
When it comes to trusted metrics that actually mean something, nothing stands stronger than email link clicks.
Measuring your click-through rate is the most accurate metric you can use. As your funnel grows and marketing matures you will find that “clicks-to-purchases” is really the only metric that gives you the best insight on how effective your email marketing is.
But that’s another post.
Have you ever been fooled by your open rates? I’d love the hear about it in the comments below…

2 comments
Eileen
I tested and sent my first email to a group with links to my editorial (also containing curated shoe features focused on color and style) for the first time.
The ability to measure these metrics with MailChimp is a little bit ‘fun’ and surely useful to play around with. Viewing who opened your email and how many times plus who clicked and what they clicked is not only interesting BUT can guide your thoughts on where to more efficiently place links the next time around or what type of products people may have been most interested in.
Yes. you can view the percentage which open on mobile and Iphone specifically which accounts for a significant portion from my initial sample.
Next time around, I would place a few links more strategically in my top paragraph message and maybe put the product curated features in the middle.
Glad to hear other thoughts as well.
Chris L. Davis
Great to hear @eil@FabulousSoles:disqus!
You are right on the money about using email metrics to determine how to position your product offering and identify what your people are interested in. Instead of guessing and hoping you’re letting the data dictate your decision making process.
I’ve had really good success placing the link higher in the email. I believe in getting straight to the point first and then offer more if needed. But if someone is ready to click no need to make them read or look at pictures beforehand. Great marketing gets people ready to click and your follow up should make clicking extremely easy to do.